
What Is a Fishbone Diagram?
Written by Jason Westland · Edited by Johanna Barnett
A fishbone diagram is a cause-mapping tool that organizes possible causes of one defined problem into categories so a team can decide what evidence to check. It is also called an Ishikawa diagram or cause-and-effect diagram.
In manufacturing quality, use it when several cause paths are plausible. The diagram does not prove root cause: each material cause must be supported, ruled out, or left open based on evidence before corrective action is selected.
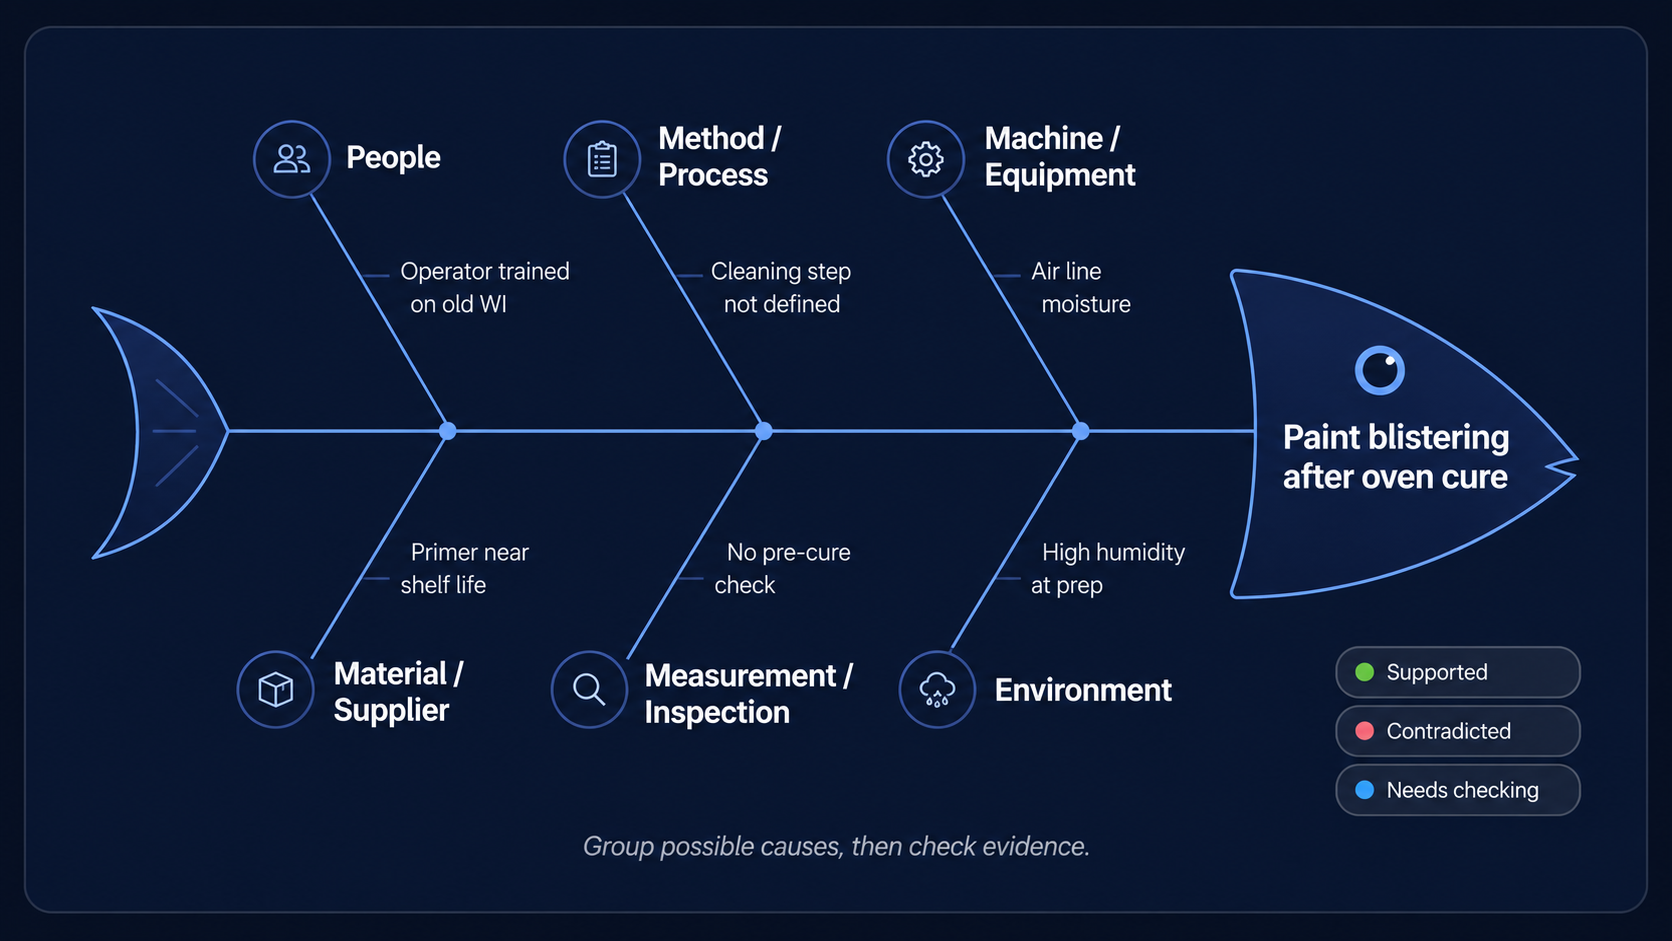
What a fishbone diagram should do
A fishbone diagram is a visual cause-mapping tool used to organize possible causes of one defined problem. The problem or effect sits at the head of the diagram, and possible causes are grouped on branches such as People, Method, Machine, Material, Measurement, and Environment.
The diagram supports structured brainstorming; it does not establish root cause. After the session, the team must review evidence and classify each material cause path as supported, ruled out, or still open before selecting corrective action.
Possible cause is not supported cause
Why it is called an Ishikawa diagram
“Fishbone diagram,” the spaced variant “fish bone diagram,” “Ishikawa diagram,” and “cause-and-effect diagram” all refer to the same tool. ASQ attributes the Ishikawa name to Kaoru Ishikawa and describes the method as a way to sort possible causes into useful categories.
When to use a fishbone diagram—and when not to
Use a fishbone diagram when the problem is defined but several plausible cause paths remain open and a cross-functional team needs to decide what evidence to check.
Use a fishbone diagram when
- the controlled requirement and actual condition are defined;
- affected and suspect scope is traceable;
- several possible causes remain credible;
- production, quality, engineering, maintenance, inspection, or supplier knowledge must be combined;
- records, parts, measurements, tests, interviews, or observations can check the proposed causes;
- the issue forms part of a broader RCA, NCR, CAR, SCAR, or 8D investigation.
Skip the fishbone when
- one cause is already supported by direct evidence and no material alternative remains open;
- the issue is low risk and isolated, the cause and correction are already understood, and no repeat or systemic pattern is present;
- the immediate work is correction or disposition rather than cause exploration;
- drawing a diagram would not change the evidence plan or decision.
Do not use the diagram to justify a cause already chosen
How to read a fishbone diagram
A fishbone diagram has a defined problem at the head, a main spine, category branches, possible causes, and evidence follow-up. The structure keeps the team focused on one effect while allowing several cause paths to remain open.
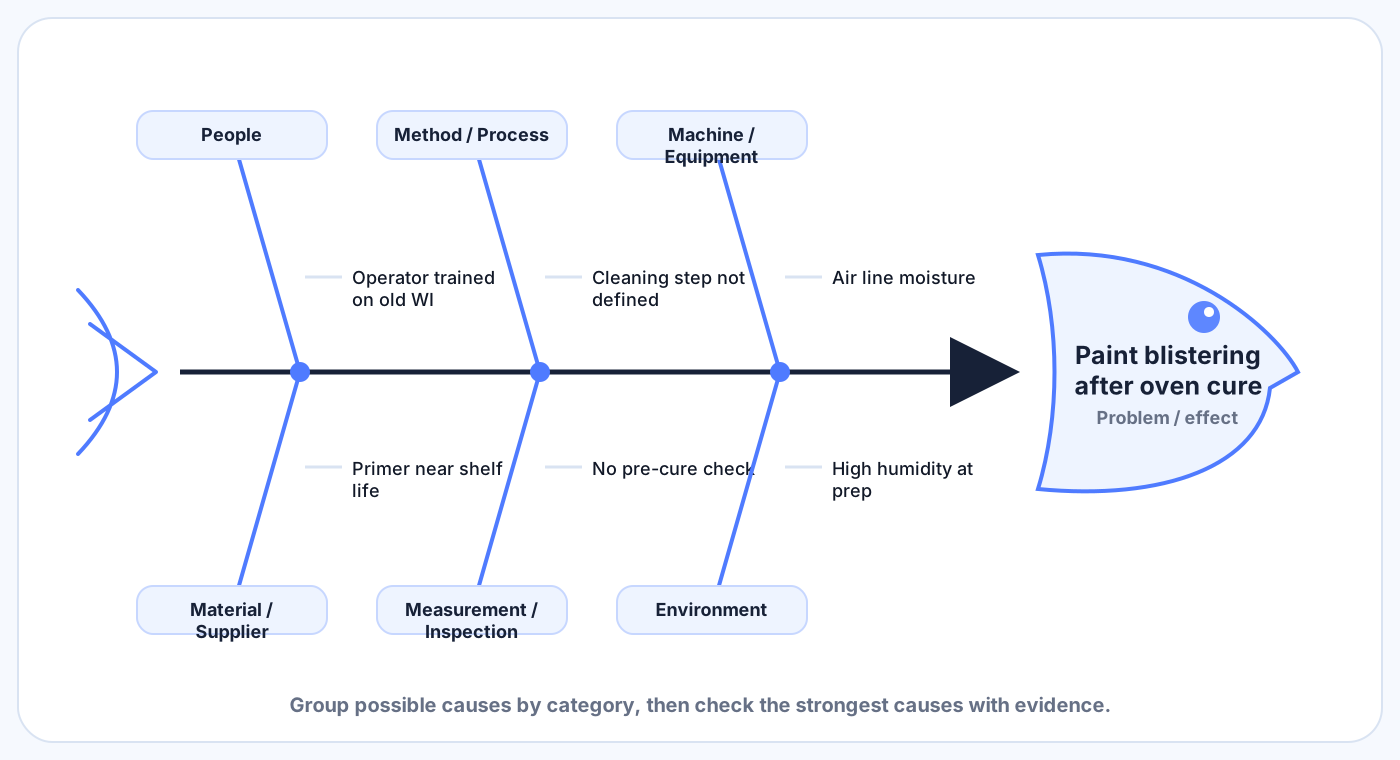
Anatomy of a six-category fishbone diagram.
| Part | Practical meaning | Quality-manager check |
|---|---|---|
| Problem or effect | The factual condition being investigated. | State the requirement, actual condition, affected and suspect scope, and where the condition was found without adding an assumed cause. |
| Main spine | Keeps every branch connected to the same defined problem. | Split the analysis when the team is trying to solve more than one effect. |
| Category branch | Groups possible causes by a practical process area. | Use categories as prompts, not mandatory quotas. |
| Possible cause | A plausible, checkable condition that might explain the problem. | Write neutral wording and identify what evidence would support or rule it out. |
| Sub-cause | A deeper condition linked logically to a possible cause. | Do not create a chain merely to reach a preferred answer. |
| Evidence follow-up | The record, part, measurement, test, interview, or observation needed next. | Assign the evidence check, owner, due date, and result in the controlling investigation record. |
Types of fishbone diagrams
Use the diagram structure that best matches the investigation. Categories are prompts rather than a mandatory template, and the visual should help the team decide what to check.

Classic 5M / 6M fishbone
The familiar manufacturing structure for defects, complaints, scrap, and process variation.

Process-step fishbone
Branches follow the process flow so the team sees where the issue entered or escaped.

Supplier issue fishbone
Separates what to check internally from what to request from the supplier.

Inspection escape fishbone
Focuses on why a defect was not detected before it reached the customer.

Service / office fishbone
Swaps shop-floor categories for service-oriented ones so it works off the floor.

Evidence-focused fishbone
Adds a review layer — Supported, Contradicted, Needs checking — after the brainstorm.
The six manufacturing cause categories
The common 6M-style categories help a manufacturing team look across the process without jumping to one answer. Rename, combine, or omit categories when that makes the investigation clearer.
| Category | Possible paths to consider | Evidence to review |
|---|---|---|
| People | Current training, role clarity, handover, temporary assignment, workload, and access to the released instruction. | Training matrix, competency record, shift roster, handover record, interviews, and direct observation. |
| Method / Process | Process sequence, setup method, work-instruction clarity, control-plan coverage, change control, rework method, and preventive-maintenance requirements. | Work instructions, drawings, specifications, control plans, setup records, change records, routings, and PM checklists. |
| Machine / Equipment | Tool or bushing wear, fixture condition, settings, program revision, sensor condition, maintenance status, and machine-specific patterns. | Machine logs, tooling records, maintenance records, setup records, program revision, condition inspection, and first-piece results. |
| Material / Supplier | Material identity, lot variation, purchased-part condition, storage, shelf life, packaging, substitutions, and supplier process changes. | Lot traceability, certificates, receiving records, retained samples, material labels, storage records, purchase orders, and supplier evidence. |
| Measurement / Inspection | Gauge suitability, calibration, inspection method, sampling, visual standards, test coverage, first-piece checks, and release review. | Measurement logs, calibration records, inspection plans, test records, sample plans, visual standards, and independent checks. |
| Environment | Temperature, humidity, contamination, lighting, layout, access, housekeeping, interruptions, and unusual production conditions. | Environmental logs, area photographs, direct observation, housekeeping records, layout drawings, and production schedules. |
Categories are prompts, not quotas
How to build and use a fishbone diagram
A useful fishbone session ends with an evidence plan, not a decorated brainstorm.
- 1
Define one factual problem
State the controlled requirement, actual condition, affected and suspect scope, where the issue was made or introduced, and where it was found. Keep the assumed cause out of the problem statement.
- 2
Keep immediate control in the controlling record
Keep containment, correction, and disposition in the originating NCR, complaint, or other controlling quality record. Link the fishbone from a CAR, SCAR, RCA, or 8D when the investigation requires it. The fishbone does not control product release.
- 3
Choose useful cause categories
Start with practical categories such as People, Method, Machine, Material, Measurement, and Environment, then adjust them to match the process and problem.
- 4
Capture neutral possible causes
Write conditions that can be checked. Use “PM checklist may not include the bushing wear limit,” not “maintenance failed.”
- 5
Separate occurrence and detection paths
Ask what could have created the nonconformance and, where relevant, what control should have detected it earlier.
- 6
Select the material paths to test
Prioritize causes by relevance to the problem, affected-versus-conforming differences, process knowledge, risk, and available evidence—not by voting alone.
- 7
Assign evidence and classify the result
Record each material path as supported, ruled out, or still open and identify the evidence used.
- 8
Transfer the supported conclusion
Record the supported cause and evidence in the controlling RCA record, 5 Whys record, 8D D4, CAR, SCAR, or corrective-action record. The applicable record owns action, implementation verification, effectiveness review, and closure.
How to move from possible causes to evidence
A fishbone diagram organizes possible causes. Evidence determines what happens to each path.
| Status | What it means | Required next step |
|---|---|---|
| Supported | The reviewed evidence is consistent with the path, explains the affected condition, and is not contradicted by material facts. | Continue the cause analysis or transfer the supported conclusion when the decision criteria are met. |
| Ruled out | The reviewed evidence contradicts the path or shows that it does not explain the affected condition. | Close the path and record the evidence used. |
| Still open | Evidence is missing, incomplete, or conflicting. | Assign the next evidence check and do not use the path as the conclusion. |
Evidence to review
- affected and conforming product;
- photographs and returned samples;
- inspection and measurement results;
- drawings, specifications, work instructions, and control plans;
- machine, setup, maintenance, and tooling records;
- calibration and measurement-system records;
- lot, batch, work-order, and shipment records;
- supplier evidence;
- interviews and direct process observation.
“No evidence found” is not “ruled out”
Occurrence cause and escape or detection weakness
For a downstream or customer escape, map two questions separately: what process or control condition created the nonconformance, and what control should have detected it before release?
Possible occurrence path
What could have created the nonconforming condition?
Review the method, setup, tooling, equipment, material, maintenance, and process controls that could explain the affected condition.
Possible detection path
What control should have detected the condition earlier?
Review the inspection characteristic, first-piece check, gauge suitability, sampling plan, test coverage, checklist, review step, and release decision.
The A-214 hole-diameter issue was found at internal inspection. Do not invent a customer escape. Review whether an earlier process control should have detected the condition, but record a detection weakness only if evidence supports one.
Do not invent an escape weakness
WORKED MANUFACTURING EXAMPLE
A-214 hole diameter out of tolerance: a worked fishbone example
This example shows how a quality team maps possible causes, selects evidence, records the supported path, and hands the conclusion to the controlling record without turning the fishbone into a completed action plan.
Example records are fictional demonstration data.
Illustrative category map: the evidence plan below retains only the material cause paths selected for checking.
Scenario summary
| Field | Example |
|---|---|
| Record and owner | NCR-2026-119; Mia Chen; internal issue. |
| Part, lot, and work order | A-214 support plates; A214-LOT-0718; WO-2026-7812. |
| Problem and requirement | Internal inspection found A-214 support plates from A214-LOT-0718 with the OP-30 hole measuring 8.18-8.23 mm against drawing DRW-A-214 Rev F requirement of 8.00 +0.05/-0.00 mm. |
| Affected and suspect scope | 36 affected / 120 suspect. |
| Containment | Hold the 120-unit suspect lot; segregate the 36 affected plates; verify remaining stock against IP-A214-03 Rev C before release. |
| Correction and disposition | Correction and disposition remain controlled in NCR-2026-119. The fishbone does not decide product disposition or release. |
Possible cause paths and evidence plan
| Category | Possible cause path | Evidence to check | Decision rule |
|---|---|---|---|
| Machine / Equipment | The OP-30 drill bushing may be worn beyond the replacement limit. | EVD-119-03 bushing wear photo; bushing gauge BG-214-08. | Compare the observed bushing condition with the approved wear limit. |
| Method / Process | PM-DRILL-08 Rev B may not require the bushing wear limit to be checked. | EVD-119-04 PM checklist review. | Check whether the released PM control required the wear limit to be reviewed and recorded. |
| Measurement / Inspection | The reported hole result may be affected by the measurement method or gauge condition. | EVD-119-01 measurement log; EVD-119-02 gauge calibration record. | Confirm the measurement system and compare the affected results with an independent check. |
| Measurement / Inspection | First-piece verification after a bushing change may be missing or incomplete. | IP-A214-03 Rev C; EVD-119-05 first-piece inspection after bushing replacement. | Check the released inspection requirement and the completed first-piece record. |
Do not fill every branch
Supported cause after evidence review
The supported cause is backed by EVD-119-01 measurement records, EVD-119-03 bushing wear photo, the BG-214-08 bushing-gauge check, and EVD-119-04 PM checklist review.
Supported occurrence cause
Correction and corrective-action handoff
Correction: replace the worn OP-30 drill bushing. Corrective actions: update PM-DRILL-08 to Rev C with the bushing wear limit and add first-piece hole verification after bushing change.
Implementation verification
Use EVD-119-05 to confirm the bushing replacement and first-piece inspection were completed and the revised control is in use.
Effectiveness target
Review the next two A-214 lots before closure and confirm the OP-30 hole meets DRW-A-214 Rev F.
Record boundary
The fishbone maps possible cause paths and records the evidence selected for checking. NCR-2026-119 remains the controlling nonconformance record; the linked corrective-action record owns action, implementation verification, effectiveness review, and closure.
Common fishbone diagram mistakes
Most fishbone mistakes are not caused by the diagram; they are caused by how the team uses it.
| Mistake | Why it fails | Better practice |
|---|---|---|
| Starting with an assumed root cause | The team searches for confirmation instead of considering material alternatives. | Start with the controlled requirement, actual condition, and affected and suspect scope. |
| Writing corrective actions on the branches | The analysis becomes an action plan before the cause is supported. | Record possible causes first and select actions only after evidence review. |
| Stopping at operator error | It misses the process or control condition that allowed the event. | Ask what information, method, equipment, layout, workload, or control allowed the error. |
| Filling every category | The diagram is padded with weak guesses. | Use categories as prompts and keep only credible, checkable paths. |
| Prioritizing by vote alone | Popularity does not establish cause. | Use affected-versus-conforming differences, process knowledge, risk, and evidence. |
| Treating missing evidence as ruled out | An untested cause remains open. | Rule out a path only when reviewed evidence contradicts it or shows that it does not explain the condition. |
| Mixing occurrence and detection | The team may fix inspection while leaving the process producing the defect, or fix production while leaving a genuine detection gap. | Map the two questions separately when an actual escape exists. |
| Ending with no evidence owner | The diagram becomes a meeting artifact rather than an investigation tool. | Assign the evidence check, owner, due date, result, and controlling record. |
A tidy fishbone without evidence is organized speculation.
How fishbone analysis connects to 5 Whys, RCA, and 8D
Fishbone analysis widens the investigation. The next method or record tests, controls, or closes the work.
| Method or record | Role after the fishbone |
|---|---|
| 5 Whys | Follow one focused, evidence-supported cause path in greater depth. |
| Root cause analysis | Test several possible causes and evidence streams before accepting a supported conclusion. |
| 8D | Use the fishbone where appropriate during D4; the 8D also controls containment, action selection, implementation, effectiveness, prevention, and closure through D1–D8. |
| Non-conformance report (NCR) | Control the requirement, actual condition, affected and suspect scope, containment, correction, disposition, evidence, approval, and closure. |
| Corrective action | Own the process or control change, owner, due date, implementation verification, effectiveness review, and closure. |
| Corrective action request (CAR) | Record a request issued by a customer or internal quality authority and the formal response required from the organization. |
| Supplier corrective action request (SCAR) | Request and review a formal corrective-action response from a supplier. |
References and further reading
Use these sources for method background, then apply your own company, customer, product, process, supplier, and industry requirements.
This guide follows established manufacturing quality frameworks (ISO 9001, AIAG, ASQ definitions) and is reviewed internally before publishing.
This is provided for general manufacturing quality use. Adapt it to your company, customer, product, process, supplier, and industry requirements before use. It is not intended for medical device, pharma, FDA, Part 11, or validated regulated workflows.
Use the fishbone diagram template
Use the matching template page when the team needs a controlled worksheet for one factual problem, possible causes by category, evidence follow-up, and the next investigation owner.